Archive for the ‘Career Guidance’ Category

Travel to university time a factor in student performance

August 14th, 2019 by Graham Attwell

My summer morning’s work is settling into a routine. First I spend about half an hour learning Spanish on DuoLingo. Then I read the morning newsletters – OLDaily, WONKHE, The Canary and Times Higher Education (THE).

THE is probably the most boring of them. But this morning they led on an interesting and important research report. In an article entitled ‘Long commutes make students more likely to drop out’, Ana McKie says:

Students who have long commutes to their university may be more likely to drop out of their degrees, a study has found.

Researchers who examined undergraduate travel time and progression rates at six London universities found that duration of commute was a significant predictor of continuation at three institutions, even after other factors such as subject choice and entry qualifications were taken into account.

THE reports that the research., commissioned by London Higher, which represents universities in the city found that “at the six institutions in the study, many students had travel times of between 10 and 20 minutes, while many others traveled for between 40 and 90 minutes. Median travel times varied between 40 and 60 minutes.”

At one university, every additional 10 minutes of commuting reduced the likelihood of progression beyond end-of-first-year assessments by 1.5 per cent. At another, the prospect of continuation declined by 0.63 per cent with each additional 10 minutes of travel.

At yet another institution, a one-minute increase in commute was associated with a 0.6 per cent reduction in the chances of a student’s continuing, although at this university it was only journeys of more than 55 minutes that were particularly problematic for younger students, and this might reflect the area these students were traveling from.

I think there are a number of implications from this study. It is highly probable that those students traveling the longest distance are either living with their parents or cannot afford the increasingly expensive accommodation in central London. Thus this is effectively a barrier to less well off students. But it is also worth noting that much work in Learning Analytics has been focused on predicting students likely to drop out. Most reports suggest it is failing to complete or to success in initial assignments that is the most reliable predicate. Yet it may be that Learning Analytics needs to take a wider look at the social, cultural, environmental and financial context of student study with a view to providing more practical support for students.

I work on the LMI for All project which provides an API and open data for Labour Market Information for mainly use in careers counseling advice and guidance and to help young people choose their future carrers or education. We already provide data on travel to work distances, based on the 2010 UK census. But I am wondering if we should also provide data on housing costs,possibly on a zonal basis around universities (although I am not sure if their is reliable data). If distances (and time) traveling to college is so important in student attainment this may be a factor students need to include in their choice of institution and course.


Is manufacturing finished in the UK?

June 12th, 2019 by Graham Attwell

The Guardian newspaper highlights a report by Cambridge University for the Department for Business, Energy and Industrial Strategy (BEIS), showing that Britain’s manufacturing sector is much larger than official figures suggest.

The report argues that official statistics, which estimate that manufacturing output accounts for 9% of national income, are based on “outdated and inaccurate methods of counting” and the figure is much higher.

The report avoids putting a fresh figure on the proportion of GDP accounted for by the sector, but one of its authors said it was nearer 15% once activities tied to the sale of UK-made products, including engineering support and contracted services, were included.

“It is essential that policymakers have accurate information on the size of manufacturing sectors in order to develop an internationally competitive industrial strategy,” said Eoin O’Sullivan, one of the report’s authors.

“In particular, policymakers need to be able to measure manufacturing in a way that better reflects how firms actually organise themselves into value networks.”

While the Guardian news spin on the report focuses on the threat to the manufacturing by tariffs on exports resulting from a no deal Brexit, the report has wider implications. Manufacturing has long been seen as in decline and is accordingly unattractive as a careers option when compared to the growing service sector. Yet the report shows the continuing importance of occupations like engineering.

Automation and the future of work: the Chatbot

April 8th, 2019 by Graham Attwell

According to the Office for National Statistics, around 1.5 million jobs in England are at high risk of some of their duties and tasks being automated in the future.

The ONS analysed the jobs of 20 million people in England in 2017, and has found that 7.4% are at high risk of automation.

Automation involves replacing tasks currently done by workers with technology, which could include computer programs, algorithms, or even robots.

Women, young people, and those who work part-time are most likely to work in roles that are at high risk of automation.

It is important to understand automation as it may have an impact on the labour market, economy and society and on the skills and qualifications young people will need in the future.

The ONS have developed a chatbot for people to find out more about automation. You can try it out below and you can download the data here.

Understanding Labour Market data

April 8th, 2019 by Graham Attwell

The increasing power of processors and the advent of Open Data provides us information in many areas of society including about the Labour Market. Labour Market data has many uses, including for research in understandings society, for economic and social planning and for helping young people and older people in planning and managing their occupation and career.

Yet data on its own is not enough. We have to make sense and meanings from the data and that is often not simple. Gender pay gap figures released by the UK Office of National Statistics last week reveal widespread inequality across British businesses as every industry continues to pay men more on average than women. This video Guardian journalist Leah Green looks at the figures and busts some of the common myths surrounding the gender pay gap.

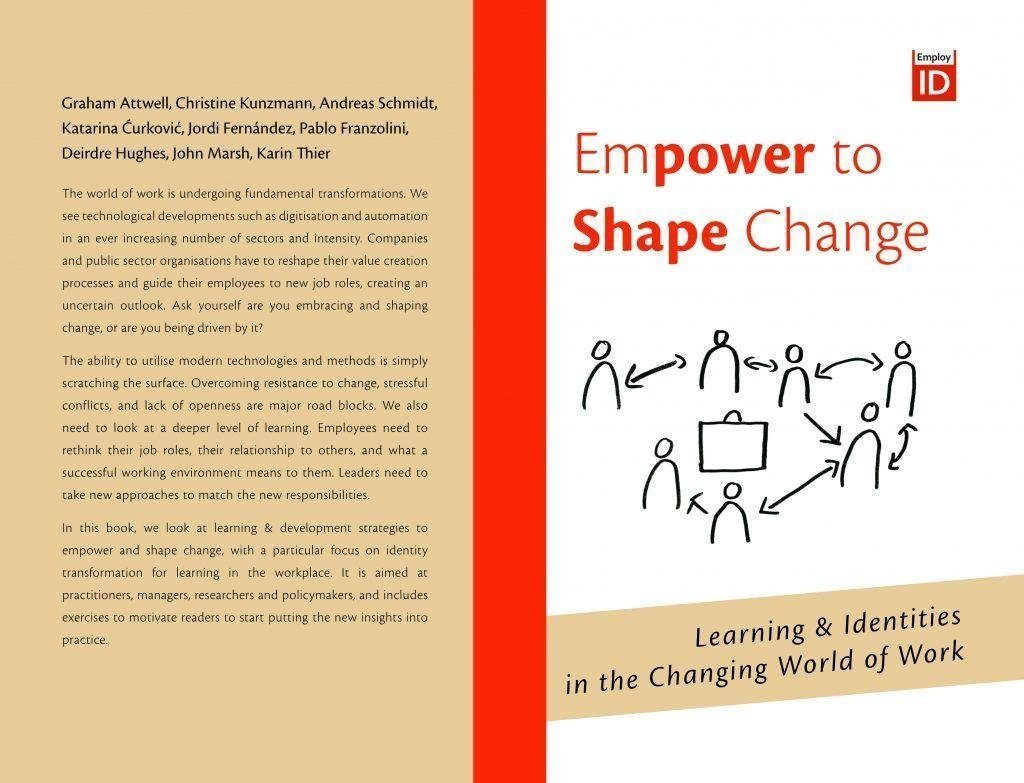
Empower to Shape Change: Learning and Identities in the Changing World of Work

March 21st, 2019 by Graham Attwell

Empower-to-Shape-Change

As regular readers of this blog will know, Pontydysgu were members of a consortium in a project called EmployID, funded by the European Commission. The project focused on changing work identities in Public Employment services and how technology could be used to support Continuing Professional Development, including both formal learning and informal learning.

All too often such project produce a series of fairly unintelligible reports before they face away. We were determined not to replicate this pattern. Instead of producing a  series of annual reports for the EU based on different project work packages, for three years of the project we produced an an unified annual report in the form of an ebook.

And the EmployId Consultancy Network , formed out of the project has now produced a short book, designed for individuals and organisations interested in organisational transformations, changing identities and learning.

The EmployId Consultancy Network is a network of researchers, practitioners and trainers offering tailored services for solutions around facilitating staff development with the focus on professional identity transformation (among them are myself, Luis Manuel Artiles Martinez, Pablo Franzolini, Deirdre Hughes, Christine Kunzmann, John Marsh, Andreas P. Schmidt, Jordi Fernández Vélez, Ranko Markus, Karin Trier, Katarina Ćurković and Adrijana Derossi).

This is what the book is about:

The world of work is undergoing fundamental transformations.

For example, nurses have mostly chosen their job because they want to care for their patients, but their work now involves, to a large degree, computer-based documentation and quality assurance measures. Practitioners in public employment services turn from administrating unemployment benefits into coaches for their clients. And engineers need to make sense of large scale sensor data and assess the opportunities of artificial intelligence techniques for their companies’ future services.We see technological developments such as digitization and automation in an ever increasing number of sectors and intensity.

Are you embracing and shaping the change or are you being driven by it?

Companies and public sector organisations have to reshape their value creation processes and guide their employees to new job roles, creating an uncertain outlook. Ask yourself are you embracing and shaping change, or are you being driven by it? The ability to utilise modern technologies and methods is simply scratching the surface. Overcoming resistance to change, stressful conflicts, and lack of openness are major road blocks. We also need to look at a deeper level of learning. Employees need to rethink their job roles, their relationship to others, and what a successful working environment means to them.

Employees and Leaders need to take new approaches to match the new responsibilities

This indicates the importance of the professional identity of individuals and occupational groups. Employees are often not given opportunities to engage in reflective learning conversations. There is a need for workers to consider the emotional aspects of their work and identity. It is important that they also acquire the skills needed to work effectively with others to move from a problem focus to a solution focus and help each other in their learning process.

In this short book, we look at strategies to empower and shape change, including the role of technology and identity transformation for learning in the workplace.The contents of this book follow a deliberate path focusing on contemporary themes. It is aimed at practitioners, managers, researchers and policymakers.

You can download a free PDF copy of the book here. Or you can order the paperback version on Amazon for Euro 14.40.

Developing a skills taxonomy

February 6th, 2019 by Graham Attwell

This morning’s mailing from the Marchmont Employment and Skills Observatory reports that NESTA have launched an interesting new Tool – a UK skills taxonomy:

“Skill shortages are costly and can hamper growth, but we don’t currently measure these shortages in a detailed or timely way. To address this challenge, we have developed the first data-driven skills taxonomy for the UK that is publicly available. A skills taxonomy provides a consistent way of measuring the demand and supply of skills. It can also help workers and students learn more about the skills that they need, and the value of those skills.” NESTA

It should help with careers guidance and is ideal for people looking at the return to differing career choices and how you get there. NESTA began with a list of just over 10,500 unique skills that had been mentioned within the descriptions of 41 million UK job adverts, collected between 2012 and 2017 and provided by Burning Glass Technologies. Machine learning was used to hierarchically cluster the skills. The more frequently two skills appeared in the same advert, the more likely it is that they ended up in the same branch of the taxonomy. The taxonomy therefore captures ‘the clusters of skills that we need for our jobs’.

The final taxonomy can be seen here and has a tree-like structure with three layers. The first layer contains 6 broad clusters of skills; these split into 35 groups, and then split once more to give 143 clusters of specific skills. Each of the approximately 10,500 skills lives within one of these 143 skill groups.

The skills taxonomy provide a rich set of data although requiring some work in interpretation. The six broad clusters of skills are:

The ten clusters (at the third layer) containing the most demanded skills are:

  1. Social work and caregiving
  2. General sales
  3. Software development
  4. Office administration
  5. Driving and automotive maintenance
  6. Business management
  7. Accounting and financial management
  8. Business analysis and IT projects
  9. Accounting administration
  10. Retail

The five skill clusters at the third layer with the highest annual median salaries are:

  1. Data engineering
  2. Securities trading
  3. IT security operations
  4. IT security standards
  5. Mainframe programming

The five clusters with the lowest salaries are:

  1. Premises security
  2. Medical administration
  3. Dental assistance
  4. Office administration
  5. Logistics administration

While the taxonomy is based on web data collected between 2012 and 2017, the approach has teh potential to be developed on the basis of real time data. And it is likely to be only one of a number of tools produced in the next two years using machine learning to analyse large data sets. The use of real-time data from web vacancies is receiving a lot of attention right now.

There is also interest in the idea of skills clusters in the ongoing debate over the impact of Artificial Intelligence on jobs and employment. Rather than whole occupations disappearing (and others surviving) it is more likely that the different skills required within occupations may change

The development of Labour Market Information systems

August 29th, 2018 by Graham Attwell

Over the past few years, part of my work has been involved in the design and development of Labour Market Information Systems. But just as with any facet of using new technologies, there is a socio-technical background to the emergence and use of new systems.

Most countries today have a more or less elaborated Labour Market Information system. In general, we can trace three phases in the development of these systems (Markowitch, 2017). Until the 1990s, Labour Market Information systems, and their attendant classification systems, mainly provided statistics for macroeconomic analysis, policy and planning. Between the 1990s and 2005 they were extended to provide data around the structuring and functioning of the Labour markets.

Mangozho (2003) attributes the change as a move from an industrial society to a post-industrial society (and the move to transition economies in Eastern Europe). Such a definition may be contentious, but he usefully charts changes in Labor market structures which give rise to different information needs. “While previously, the economic situation (especially the job structure) was relatively stable, in the latter phase the need for LMI increases because the demand for skills and qualifications changes fundamentally; the demand for skills / qualifications changes constantly, and because of these changes, Vocational Education and Training (VET) system has to be managed more flexibly (ETF, 1998)’.

He says: “In the industrial/pre-transition periods:

  • The relationship between the education and training system and the Labor market was more direct.
  • Occupational structures changed very slowly and as such, the professional knowledge and skills could easily be transferred.
  • Planning, even for short-term courses, could be done well in advance, and there was no need to make any projections about the future demands of occupations
  • The types of subjects and the vocational content required for specific jobs were easily identifiable.
  • There was little need for flexibility or to design tailor-made courses.
  • The education system concentrated on abstract and theoretical knowledge as opposed to practical knowledge.
  • Steady economic growth made it possible for enterprises to invest in on the job training.
  • There was less necessity to assess the relevance and adequacy of the VET system because it was deemed as adequate.
  • A shortage of skills could easily be translated into an increase of the number of related training institutions or student enrolments without necessarily considering the cost effectiveness of such measures. (Sparreboom, T, 1999).
  • Immediate employment was generally available for those who graduated from the education and training systems.”

Changes in the structure and functioning of Labour markets and the VET systems led to a greater need for comprehensive LMI to aid in the process of interpreting these structural shifts and designing effective HRD policies and programs, which provide for more linkages between the education and training systems and the Labor market.

At the same time, the reduction in the role of the state as a major employment provider and the development of market economies gave impetus to the need for a different approach to manpower planning, where the results of Labor market analysis as well as market based signals of supply and demand for skills are made available to the various economic agents responsible for the formulation and implementation of manpower and employment policies and programmes.

This led to the establishment of formal institutions to co-ordinate the generation of LMI, for instance internet based Labour Market Information Systems and the setting up of Labour Market Observatories and the development of more tangible LMI products, which provide a broad up, dated knowledge of the developments on the Labour market for different users.

Since 2005, Labour Market Information systems have been once more extended to incorporate both matching of jobs to job seekers and matching of supply and demand within Labour markets, particularly related to skills.

Data and the future of universities

August 2nd, 2018 by Graham Attwell

I’ve been doing quite a lot of thinking about how we use data in education. In the last few years two things have combined – the computing ability to collect and analyse large datasets, allied to the movement by many governments and administrative bodies towards open data.

Yet despite all the excitement and hype about the potential of using such data in education, it isn’t as easy as it sounds. I have written before about issues with Learning Analytics – in particular that is tends to be used for student management rather than for improving learning.

With others I have been working on how to use data in careers advice, guidance and counselling. I don’t envy young people today in trying to choose and  university or college course and career. Things got pretty tricky with the great recession of 2009. I think just before the banks collapsed we had been putting out data showing how banking was one of the fastest growing jobs in the UK. Add to the unstable economies and labour markets, the increasing impact of new technologies such as AI and robotics on future employment and it is very difficult for anyone to predict the jobs of the future. And the main impact may well be nots o much in new emerging occupations,or occupations disappearing but in the changing skills and knowledge required n different jobs.

One reaction to this from many governments including the UK has been to push the idea of employability. To make their point, they have tried to measure the outcomes of university education. But once more, just as student attainment is used as a proxy for learning in many learning analytics applications, pay is being used as a proxy for employability. Thus the Longitudinal Education Outcomes (LEO) survey, an experimental survey in the UK, users administrative data to measure the pay of graduates after 3, 5 and 0 years, per broad subject grouping per university. The trouble is that the survey does not record the places where graduates are working. And once thing we know for a certainty is that pay in most occupations in the UK is very different in different regions. The LEO survey present a wealth of data. But it is pretty hard to make any sense of it. A few things stand out. First is that UK labour markets look pretty chaotic. Secondly there are consistent gender disparities for graduates of the same subject group form individual universities. The third point is that prior attainment before entering university seems a pretty good predictor of future pay, post graduation. And we already know that prior attainment is closely related to social class.

A lot of this data is excellent for research purposes and it is great that it is being made available. But the collection and release of different data sets may also be ideologically determined in what we want potential students to be able to find out. In the same way by collecting particular data, this is designed to give a strong steer to the directions universities take in planning for the future. It may well be that a broader curriculum and more emphasis on process and learning would most benefits students. Yet the steer towards employability could be seen to encourage a narrower focus on the particular skills and knowledge employers say they want in the short term and inhibit the wider debates we should be having around learning and social inclusion.


Learning about Careers: Open data and Labour Market Intelligence

August 1st, 2018 by Graham Attwell

I’ve spent a lot of the last two months writing papers. I am not really sure why – other than people keep asking me to and I really do have a built up load of things which I haven’t written about. But one bad consequence of all this is I seem to have abandoned this blog. So,  time to start catching up here.

This paper – Learning about Careers: Open data and Labour Market Intelligence – is co-written with Deirdre Hughes. It is a preprint and wil be published in RIED – Revista Iboeroamericana de Educación a Distancia (The Iberoamerican Review of Digital Education) some time soon.

The full paper can be found on Research Gate or alternatively you can download it here. The abstract is as follows:

“Decisions about learning and work have to be placed in a particular spatial, labour market and socio-cultural context – individuals are taking decisions within particular ‘opportunity structures’ and their decisions and aspirations are further framed by their understanding of such structures. This article examines ways in which learning about careers using open data and labour market intelligence can be applied. An illustrative case study of the LMI for All project in the UK shows the technical feasibility of designing and developing such systems and a model for dissemination and impact. The movement towards Open Data and increasingly powerful applications for processing and querying data has gathered momentum. This combined with the need for labour market information for decision making in increasingly unstable labour markets have led to the development and piloting of new LMI systems, involving multiple user groups. Universal challenges exist given the increasing use of LMI, especially in job matching and the rapidly expanding use of open source data in differing education and employment settings. We highlight at least six emergent issues that have to be addressed so that open data and labour market intelligence can be applied effectively in differing contexts and settings. We conclude by reflecting on the urgent need to extend the body of research and to develop new methods of co-constructing in innovative collaborative partnerships.”


Are job algorithms good enough?

February 22nd, 2018 by Graham Attwell

We’ve all made jokes about the jobs that various ‘professional’ social networks recommend for us.  This morning I had a message from ResearchGate:

LinkedIn is no better. Here are tworesearchgate jobs it recently found for me:

linkedin

Goodness knows how they  vaguely thought I was qualified for these jobs. But never mind – it is only the usual nonsense form free social networks, we think. But it does matter. These reconsiderations come through algorithms. And nearly every Public Employment Service I have talked to is either trialling or considering trialling software which matches applicants to jobs. OK, the algorithms may be better written. And probably the employment services have more data on both applicants and jobs that has the likes of ReseachGate and LinkedIn. But in seeking to provide a better service at less cost through the use of technology the employment services are ignoring that many people need guidance and support when seeking employment form qualified professionals. Taking a job is not like ticking a like on a social website.  It involves serious decisions which can affect peoples futures and the future of their family.  And, at the moment, Artifical Intelligence is not enough for helping in those decisions.

  • Search Pontydysgu.org

    Social Media


    News Bites

    Cyborg patented?

    Forbes reports that Microsoft has obtained a patent for a “conversational chatbot of a specific person” created from images, recordings, participation in social networks, emails, letters, etc., coupled with the possible generation of a 2D or 3D model of the person.


    Racial bias in algorithms

    From the UK Open Data Institute’s Week in Data newsletter

    This week, Twitter apologised for racial bias within its image-cropping algorithm. The feature is designed to automatically crop images to highlight focal points – including faces. But, Twitter users discovered that, in practice, white faces were focused on, and black faces were cropped out. And, Twitter isn’t the only platform struggling with its algorithm – YouTube has also announced plans to bring back higher levels of human moderation for removing content, after its AI-centred approach resulted in over-censorship, with videos being removed at far higher rates than with human moderators.


    Gap between rich and poor university students widest for 12 years

    Via The Canary.

    The gap between poor students and their more affluent peers attending university has widened to its largest point for 12 years, according to data published by the Department for Education (DfE).

    Better-off pupils are significantly more likely to go to university than their more disadvantaged peers. And the gap between the two groups – 18.8 percentage points – is the widest it’s been since 2006/07.

    The latest statistics show that 26.3% of pupils eligible for FSMs went on to university in 2018/19, compared with 45.1% of those who did not receive free meals. Only 12.7% of white British males who were eligible for FSMs went to university by the age of 19. The progression rate has fallen slightly for the first time since 2011/12, according to the DfE analysis.


    Quality Training

    From Raconteur. A recent report by global learning consultancy Kineo examined the learning intentions of 8,000 employees across 13 different industries. It found a huge gap between the quality of training offered and the needs of employees. Of those surveyed, 85 per cent said they , with only 16 per cent of employees finding the learning programmes offered by their employers effective.


    Other Pontydysgu Spaces

    • Pontydysgu on the Web

      pbwiki
      Our Wikispace for teaching and learning
      Sounds of the Bazaar Radio LIVE
      Join our Sounds of the Bazaar Facebook goup. Just click on the logo above.

      We will be at Online Educa Berlin 2015. See the info above. The stream URL to play in your application is Stream URL or go to our new stream webpage here SoB Stream Page.

  • Twitter

  • Recent Posts

  • Archives

  • Meta

  • Categories