Archive for the ‘Wales Wide Web’ Category

Data Driven Science

September 29th, 2020 by Graham Attwell

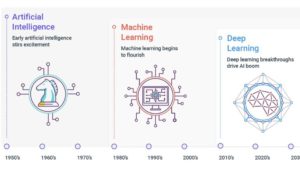
This diagram is from a tweet by  Data Driven Science (@DrivenScience).

Artificial Intelligence they say, is the broad discipline of creating intelligent machines.

Machine Learning refers to systems that can learn from experience.

Deep Learning refers to experience on large data sets.

The State of Data 2020

September 28th, 2020 by Graham Attwell
social media, media, board

geralt (CC0), Pixabay

One result of the Covid 19 pandemic is it seems like every day now there are free events. This week is no exception and this conference looks great. I can’t make all of it – too many other meetings but I hope to dip in and out (another advantage of online conferences).

On Tuesday September 29 and Wednesday September 30, 2020 the State of Data event will bring together researchers, practitioners, and anyone with an interest in why data matters in state education in England.

You can choose to register if you want to use the calendar functionality and accept the privacy terms of Hopin, to see the events as they come live. Or simply watch in your own time without registering, after the event, via the links below.

Between algorithmic fairness in exam moderation and the rush to remote learning in response to the COVID-19 pandemic, 2020 has raised questions on children’s digital rights like never before in England’s education system. defenddigitalme is a call to action.

The conference has a vision of a rights’ respecting environment in the state education sector in England. We want to help build the future of safe, fair and transparent use of data across the public sector. This event will coincide with the launch of their report The State of Data 2020: mapping the data landscape in England’s state education system.

There is a range of content and discussion for practitioners in education and data protection, senior leadership and DPOs, local authority staff, developers, vendors and the edTech community, academics and activists, policy advisors and politicians —they say they want to create opportunities for questions and answers across silos. As the conference web site says: “We need to start a conversation about changing policy and practice when it comes to children’s data rights in education.”

Economic catastrophe?

September 23rd, 2020 by Graham Attwell
looking for a job, work, silhouettes

geralt (CC0), Pixabay

COVID-19 is turning from a health crisis into an economic catastrophe, says the UK based Nesta. With the Government’s Coronavirus Job Retention scheme closing at the end of October, the coming labour market shock will be unprecedented in scale and there is a major risk of people being unable to meet housing or food costs and falling into debt.

Navigating the labour market will be challenging, especially for people in insecure and low-paid employment. Despite the emergence of a range of online products and services, some basic needs – like matching people to training and education courses that provide the best return – are not being met.

Further, although a range of financial services already exist to support vulnerable families, the scale and accessibility of these services are out of kilter with what is now required.

To stimulate innovation in these fields, Nesta launched the Rapid Recovery Challenge – a new £2.8 million challenge prize seeking scalable ways of giving vulnerable workers better access to jobs and financial help in the wake of COVID-19.

Find out more about the challenge prize.

Language courses and science, technology, engineering and maths subjects cut

September 16th, 2020 by Graham Attwell
jet engine, jet, airplane

LittleVisuals (CC0), Pixabay

Over the past few years there has been great emphasis placed in the UK on the importance of science, engineering, technology and maths (STEM) for the future development of the economy. there has also been attention placed on the poor record of language learning in the country. And education – and especially the vocational further education colleges have been urged to ensure that employability is high on te agenda.

It is surprising then to see the latest report from the UK nation Audit Office which has found that “Some colleges have stopped teaching modern languages courses and some science, technology, engineering and maths subjects, while others have significantly decreased employability activities.”

As a report on Sky News says, the Aidit Office report the reason being that core funding for the college sector has fallen and its financial health “remains fragile” – with an increasing number of colleges across the UK under financial pressure due to the coronavirus crisis.

The report warned that mental health and careers support for college students had also reduced.

More ways of understanding the Labour Market

September 15th, 2020 by Graham Attwell
architecture, skyscraper, glass facades

MichaelGaida (CC0), Pixabay

In most countries we have traditionally relied on official labour market agencies for data for understanding the labour market. From an education and training standpoint, that data has not always been ideal – given the main users are economic planners and policy makers – and the data collected is often difficult to interpret from the viewpoint of careers guidance or education and training provision.

One of the main limitations of national data from official agencies is that the sample is often too small to draw conclusions at a local – or sometimes even regional – level. Yet opportunities for employment vary greatly by region, town and city. In recent years there has been a growth in popularity of scraped data, using big data technologies and techniques to scrape and analyse online job vacancies. This work has mainly been undertaken by US based private sector companies although the EU CEDEFOP agency has also developed a multi national project scraping and analysing data. The job advert data is not better or worse than tradition labour market data. It is another source of data providing another angle from how to understand what is going on. Pontydysgu is part of a consortium in the final of the  UK Nesta CareerTech Challenge prize. Our main word is developing a Chatbot for providing information for people whose jobs are at risk as a result of automation and AI. Of course that includes labour market information as well as possibly scraped data and we have been thinking about other sources of data, not traditionally seen as labour market information.

One organisation which is accessing, visualising and publishing near real time data is the Centre for Cities in the UK. It says its mission is to help the UK’s largest cities and towns realise their economic potential.

We produce rigorous, data-driven research and policy ideas to help cities, large towns and Government address the challenges and opportunities they face – from boosting productivity and wages to preparing for Brexit and the changing world of work.

We also work closely with urban leaders, Whitehall and business to ensure our work is relevant, accessible and of practical use to cities, large towns and policy makers

Since the start of the Covid 19 pandemic the Centre for Cities has been tracking the impact on the labour market. They say:

Luton, Slough and Blackpool have seen the largest increases in unemployment since lockdown began. Meanwhile, cities and towns in predominantly in southern England and The Midlands have seen smaller increases in unemployment. Cambridge, Oxford, Reading, Aberdeen and York have seen some of the smallest increases in unemployment since March.

As of mid-June Crawley, Burnley, Sunderland and Slough have the largest shares of people being paid by the Government’s furlough scheme.

In the medium term, as many as one in five jobs in cities and large towns could be at risk of redundancy or furloughing, and those reliant on the aviation industry, such as Crawley and Derby, are likely to be hardest hit. These areas are also the places most likely to be worst affected if the Job Retention Scheme is withdrawn too soon.

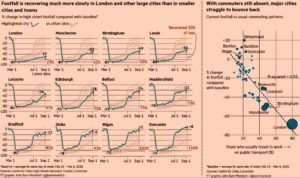
One interesting tool is the high street recovery tracker. This compares the economic performance of city centers since the outset of the Covid 19 crisis. At present they say footfall in the UKs 63 biggest cities has increased by seven percentage points in August and now reaches 63 per cent of pre-lockdown levels.

However, this figure hides great geographic differences: in 14 city centres, footfall in August exceeded pre-lockdown levels; particularly in seaside towns and smaller cities. At the other end of the spectrum, large cities like Manchester and Birmingham have barely recovered half of their pre-lockdown levels of activity.

Instead of relying on traditional surveys for this data, which would take some time to process and analyse, the recovery tracker is based on mobile phone analysis. Another potentially interesting non traditional source of data for understanding labour markets may be travel data, although that data is heavily disrupted by Covid 19. But that disruption in itself may be interesting, given the likelihood that those cities with continuing low travel to work numbers are likely to have a higher percentage of office based work, and possibly a focus on non customer based finance and administration employment. Conversely those cities where travel to work volumes are approaching near normal are probably more concentrated on retail and manufacturing industry.

All in all, there is a lot going on in novel data sources for labour market information. And of course we are also looking at how such data might be accessed:hence our Chatbot project.

What’s happening to the labour market?

September 14th, 2020 by Graham Attwell
looking for a job, work, silhouettes

geralt (CC0), Pixabay

Its pretty hard guessing the future of the labour market at the moment. How bad is the downturn from the Convid 19 pandemic going  to be. Will there be U shaped recession or will there be a rapid V shaped recovery. Who will be hit hardest? What will happen to the hospitality and travel industries. What kind of policies might mitigate against a recession. And what kind of education and training measure are needed?

Things are slowly becoming clearer. And the indicators are not good.

The Brighton based Centre for Employment Studies (CES) released a briefing note today using newly released data from employers planning 20 or more redundancies alongside historic estimates of actual redundancies, in order to estimate the potential path of job losses this year. The CES were only able to obtain the data from the government followin a Freedom of Information request. Estimates of the actual historic level of redundancies are taken from the Labour Force Survey.

Their analysis suggests that redundancy notifications by employers are running at more than double the levels seen in the 2008/9 recession, the vast majority of which is a consequence of the covid-19 pandemic and its economic impacts. The CES estimates  that this may lead to around 450 thousand redundancies in the third quarter of 2020 – significantly higher than the quarterly peak in the last recession (of just over 300 thousand) – and a further 200 thousand redundancies in the final quarter of the year.

Among measure that they suggest are needed to deal with the employment crisis is guaranteed access to rapid, high quality employment and training support for those facing redundancy.

The full report can be downloaded here.


Accountability and algorithmic systems

September 3rd, 2020 by Graham Attwell
programming, computer language, program

geralt (CC0), Pixabay

There seems to be a growing awareness of the use and problems with algorithms – at least in the UK with what Boris Johnson called “a rogue algorithm” caused chaos in students exam results. It is becoming very apparent that there needs to be far more transparency in what algorithms are being designed to do.

Writing in Social Europe says “Algorithmic systems are a new front line for unions as well as a challenge to workers’ rights to autonomy.” She draws attention to the increasing surveillance and monitoring of workers at home or in the workplace. She says strong trade union responses are immediately required to balance out the power asymmetry between bosses and workers and to safeguard workers’ privacy and human rights. She also says that improvements to collective agreements as well as to regulatory environments are urgently needed.

Perhaps her most important argument is about the use of algorithms:

Shop stewards must be party to the ex-ante and, importantly, the ex-post evaluations of an algorithmic system. Is it fulfilling its purpose? Is it biased? If so, how can the parties mitigate this bias? What are the negotiated trade-offs? Is the system in compliance with laws and regulations? Both the predicted and realised outcomes must be logged for future reference. This model will serve to hold management accountable for the use of algorithmic systems and the steps they will take to reduce or, better, eradicate bias and discrimination.

Christina Colclough believes the governance of algorithmic systems will require new structures, union capacity-building and management transparency.I can’t disagree with that. But also what is needed is a greater understanding of the use of AI and algorithms – for good and for bad. This means an education campaign – in trade unions but also for the wider public to ensure that developments are for the good and not just another step in the progress of Surveillance Capitalism.

Understanding the changing Covid-19 labour market

August 26th, 2020 by Graham Attwell
looking for a job, work, silhouettes

geralt (CC0), Pixabay

Yesterday I attended a webinar organized by the UK Association of Colleges in their Labour Market Observatory Series. The subject of the webinar was Using Job Posting Analytics to understand the changing Covid-19 labour market.

Understanding labour markets is a hard job at the best of time and the Covid-19 pandemic and the resulting lockdown have disrupted the economy with unprecedented speed and scale. As Duncan Brown, Senior Economist from Emsi, explained, raditional labour market statistics take time to emerge, especially to understand what’s going at regional and local level, and real-time indicators become all-important. Duncan Brown, talked through what their Job Posting Analytics – derived from collecting (or scraping) around 200,000 new, unique job postings from job boards across the internet every week — can tell us about where and how the labour market is changing and what to look for as we move into the recovery.

First though he explained how the data is collected using bots before being cleaned and duplication removed, prior to using algorithms to analyse the data. He pointed out that there are limitations to the data derived from job adverts but compared to the time taken for official labour market data to emerge, for instance through the UK National Office of Statistics Labour Force Survey (LFS)job posting analytics can provide an almost real time snapshot view of the labour market, and is easily projected at a local level.

My notes on the webinar are somewhat patchy but here are a few take home points, particularly from a question and answer session that followed Duncan Brown’s presentation.

There was a huge fall in online job adverts in April and May with the lockdown – as high as 80 per cent in some sectors and localities. Since then there has been a steady recovery in the number of jobs being advertised online but this recovery is uneven between different sectors and different cities and regions.

As examples offers of employment in the food and hospitality. Industries remain dire and aerospace is also still badly hit. On the other hand, job advert volumes in manufacturing have substantially recovered and, perhaps understandably there is an increase in jobs adverts in health care.

There is considerable differences as to how far the volume of job adverts has recovered (or otherwise) in different cities. In general, it would appear that those cities with the largest percentage of office work and of commuters are doing worse: London in particular.

One area of the labour market that Emsi is focusing on is skills demand. They have developed their own skills directory, which Duncan Brown said, now contains over 3000 skills and are running a project funded by Nesta to see if these skills can be clustered around different occupations. Yet despite the so-called pivot to skills, he said there few signs that employers were. Moving away from the traditional emphasis on qualifications. However, qualification demands often did not appear in job adverts but rather tended to be assumed by both employers and job applicants. For instance, someone applying for a job as an accountant would presume that they needed formal qualifications.

Although there have long been predictions over the impact of automation and AI on employment, Duncan Brown said there was little evidence of this. His feeling is that, at least in the UK, the existence of relatively cheap labour in many sectors where it would be relatively easy to automate tasks, was a disincentive to the necessary investment. He thought that labour costs may have been kept down by immigration. He pointed to car washes as an example of an area where far from advancing automation had actually gone backwards.

The slides from the presentation and a recording of the webinar will be available from 27 August on the Association of Colleges website.


Marginal voices and non-dominant epistemic stances in open education

August 20th, 2020 by Graham Attwell

One way or another I have been involved in the open education debate for many years. Pontydysgu were a partner in the first projects Cover image for Open at the Marginssponsored by the European Commission to promote firstly open source software and subsequently open educational resources. And since then, some fifteen or so years ago we have published everything under a Creative Commons license. And slowly over the years the debate has shifted, over the past years looking at the meaning of open education practices.

More recently a debate has emerged over diversity and over non-dominant epistemic stances in open education. Now, many of those voices in the debate have contributed to an open book entitled Open at the Margins with the subtitle: Critical Perspectives on Open Education. The book is edited by Maha Bali, Catherine Cronin, Laura Czerniewicz, Robin DeRosa, and Rajiv Jhangiani and is licensed under a Creative Commons Attribution-ShareAlike 4.0 International License.

The description of the book says:

Open education is at a critical juncture. It has moved on from its northern roots and is increasingly being challenged from its own periphery. At the same time, it finds itself marginalised and under threat in an educational sector infiltrated by corporate interests. However, rather than bunkering down, becoming blinkered or even complacent, the editors of this volume believe that the voices from the periphery should be amplified. This book represents a starting point towards curating and centering marginal voices and non-dominant epistemic stances in open education, an attempt at critical pluriversalism. It is a curated collection of 38 blog posts, lectures, talks, articles, and other informal works contributed by 43 diverse authors/co-authors and published since 2013. Each of these contributions offers a perspective on open education that can be considered marginal and that challenges the dominant hegemony.

The book is free for download from the Rebus Community website. I havent read it yet but its on my list for this weekend. If it lives up to its description it is a very welcome and necessary contribution to the debate.


AI and Algorithms: the UK examination debacle

August 20th, 2020 by Graham Attwell

This article was originally published on the Taccle AI web site.

There’s a lot to think about in the ongoing debacle over exam results in the UK. A quick update for those who have not been following the story. Examinations for young people, including the O level and A level academic exams and the more vocationally oriented Btec were cancelled this year due to the Covid19 pandemic. Instead teachers were asked to firstly provide an estimated grade for each student in each subject and secondly to rank order the students in their school.

These results were sent to a government central agency, the Office of Qualifications known as Ofqual. But instead of awarding qualifications to students based on the teachers’ predicted grades, it was decided by Ofqual, seemingly in consultation or more probably under pressure, by the government to use an algorithm to calculate grades. This was basically based on the previous results achieved by the school in each subject, with adjustments made for small class cohorts and according to the rankings.

The results from the A levels were released last week. They showed massive irregularities at an individual level with some students seemingly downgraded from predicted A* *the highest grade, to a C or D. Analysis also showed that those students from expensive private schools tended to do better than expected, whilst students from public sector schools in working class areas did proportionately worse than predicted. In other words, the algorithm was biased.

As soon as the A level results were announced there were protest from teachers, schools and students. Yet the government stuck to its position, saying there would be no changes. The Prime Minister Boris Johnson said “Let’s be in no doubt about it, the exam results wed have got today are robust, they’re good, they’re dependable for employers”. However, concern quickly grew about the potential of numerous appeals and indeed at the time it would take teachers preparing such appeals. Meanwhile the Scottish government (which is autonomous in education policy) announced that they would revert of the teachers’ predicted grades. In England while the government stood firm demonstrations by school students broke out in most cities. By the weekend it was clear that something had to change and on Monday the UK government, responsible for exams in England and Wales, announced that they too would respect teacher predicted grades.

The political fallout goes on. The government is trying to shift the blame to Ofqual, despite clear evidence that they knew what was happening.  Meanwhile some of the universities who are reliant on the grades for the decision over who to offer places to, are massively oversubscribed as a result of the upgrades.

So, what does this mean for the use of AI in education. One answer maybe that there needs to be careful thinking about how data is collected and used. As one newspaper columnist put it as the weekend “Shit in, shit out”. Essentially the data used was from the exam results of students at a collective school level in previous years. This has little or no relevance as to how an individual student might perform this year. In fact, the algorithm was designed with the purpose not of awarding an appropriate grade for a student to reflect their learning and work, but to prevent what is known as grade inflation. Grade inflation is increasing numbers of students getting higher grades each year. The government sees this as a major problem.

But this in turn has sparked off a major debate, with suspicions that the government does in fact support a bias in results, aiming to empower the elite to attend university with the rest heading for a second class vocational education and training provision. It has also been pointed out that the Prime Ministers senior advisor, Dominic Cummings, has in the past written articles appearing to suggest that upper class students are more inherently intelligent than those from the working class.

The algorithm, although blunt in terms of impact, merely replicated processes that have been followed for many years (and certainly preceding big data). Many years ago, I worked as a project officer for the Wales Joint Education Committee (WJEC). The WJEC was the examination board for Wales. At that time there were quite a number of recognized examination boards, although since then the number has been reduced by mergers. I was good friends with a senior manager in the exam board. And he told me that every year, about a week before the results were announced, each exam board shared their results, including the number of students to be awarded each grade. The results were then adjusted to fit the figures that the boards had agreed to award in that year.

And this gets to the heart of the problems with the UK assessment system. Of course, one issue is the ridiculous importance placed on formal examinations. But it also reflects the approach to assessment. Basically, there are three assessment systems. Criteria based assessment means that any students achieving a set criterion are awarded accordingly. Ipsative based assessment, assesses achievement based on the individuals own previous performance. But in the case of UK national exams the system followed is norm referenced, which means that a norm is set for passing and for grading. This is fundamentally unfair, in that if the cohort for one year is high achieving the norm will be raised to ensure that the numbers achieving any particular grade meet the desired target. The algorithm applied by Ofqual weas essentially designed to ensure results complied with the norm, regardless of individual attainment. It has always been done this way, the difference this year was the blatant crudeness of the system.

So, there is a silver lining, despite the stress and distress caused for thousands of students. At last there is a focus on how the examination system works, or rather does not. And there is a focus on the class-based bias of the system which has always been there. However, it would be a shame if the experience prevents people from looking at the potential of AI, not for rigging examination results, but for supporting the introduction of formative assessment or students to support their learning.

If you are interested in understanding more about how the AI based algorithm worked there is an excellent analysis by Tom Haines in his blog post ‘A levels: the Model is not the Student‘.
 

  • Search Pontydysgu.org

    Social Media


    News Bites

    Cyborg patented?

    Forbes reports that Microsoft has obtained a patent for a “conversational chatbot of a specific person” created from images, recordings, participation in social networks, emails, letters, etc., coupled with the possible generation of a 2D or 3D model of the person.


    Racial bias in algorithms

    From the UK Open Data Institute’s Week in Data newsletter

    This week, Twitter apologised for racial bias within its image-cropping algorithm. The feature is designed to automatically crop images to highlight focal points – including faces. But, Twitter users discovered that, in practice, white faces were focused on, and black faces were cropped out. And, Twitter isn’t the only platform struggling with its algorithm – YouTube has also announced plans to bring back higher levels of human moderation for removing content, after its AI-centred approach resulted in over-censorship, with videos being removed at far higher rates than with human moderators.


    Gap between rich and poor university students widest for 12 years

    Via The Canary.

    The gap between poor students and their more affluent peers attending university has widened to its largest point for 12 years, according to data published by the Department for Education (DfE).

    Better-off pupils are significantly more likely to go to university than their more disadvantaged peers. And the gap between the two groups – 18.8 percentage points – is the widest it’s been since 2006/07.

    The latest statistics show that 26.3% of pupils eligible for FSMs went on to university in 2018/19, compared with 45.1% of those who did not receive free meals. Only 12.7% of white British males who were eligible for FSMs went to university by the age of 19. The progression rate has fallen slightly for the first time since 2011/12, according to the DfE analysis.


    Quality Training

    From Raconteur. A recent report by global learning consultancy Kineo examined the learning intentions of 8,000 employees across 13 different industries. It found a huge gap between the quality of training offered and the needs of employees. Of those surveyed, 85 per cent said they , with only 16 per cent of employees finding the learning programmes offered by their employers effective.


    Other Pontydysgu Spaces

    • Pontydysgu on the Web

      pbwiki
      Our Wikispace for teaching and learning
      Sounds of the Bazaar Radio LIVE
      Join our Sounds of the Bazaar Facebook goup. Just click on the logo above.

      We will be at Online Educa Berlin 2015. See the info above. The stream URL to play in your application is Stream URL or go to our new stream webpage here SoB Stream Page.

  • Twitter

  • Recent Posts

  • Archives

  • Meta

  • Categories