More ways of understanding the Labour Market

MichaelGaida (CC0), Pixabay
In most countries we have traditionally relied on official labour market agencies for data for understanding the labour market. From an education and training standpoint, that data has not always been ideal – given the main users are economic planners and policy makers – and the data collected is often difficult to interpret from the viewpoint of careers guidance or education and training provision.
One of the main limitations of national data from official agencies is that the sample is often too small to draw conclusions at a local – or sometimes even regional – level. Yet opportunities for employment vary greatly by region, town and city. In recent years there has been a growth in popularity of scraped data, using big data technologies and techniques to scrape and analyse online job vacancies. This work has mainly been undertaken by US based private sector companies although the EU CEDEFOP agency has also developed a multi national project scraping and analysing data. The job advert data is not better or worse than tradition labour market data. It is another source of data providing another angle from how to understand what is going on. Pontydysgu is part of a consortium in the final of the UK Nesta CareerTech Challenge prize. Our main word is developing a Chatbot for providing information for people whose jobs are at risk as a result of automation and AI. Of course that includes labour market information as well as possibly scraped data and we have been thinking about other sources of data, not traditionally seen as labour market information.
One organisation which is accessing, visualising and publishing near real time data is the Centre for Cities in the UK. It says its mission is to help the UK’s largest cities and towns realise their economic potential.
We produce rigorous, data-driven research and policy ideas to help cities, large towns and Government address the challenges and opportunities they face – from boosting productivity and wages to preparing for Brexit and the changing world of work.
We also work closely with urban leaders, Whitehall and business to ensure our work is relevant, accessible and of practical use to cities, large towns and policy makers
Since the start of the Covid 19 pandemic the Centre for Cities has been tracking the impact on the labour market. They say:
Luton, Slough and Blackpool have seen the largest increases in unemployment since lockdown began. Meanwhile, cities and towns in predominantly in southern England and The Midlands have seen smaller increases in unemployment. Cambridge, Oxford, Reading, Aberdeen and York have seen some of the smallest increases in unemployment since March.
As of mid-June Crawley, Burnley, Sunderland and Slough have the largest shares of people being paid by the Government’s furlough scheme.
In the medium term, as many as one in five jobs in cities and large towns could be at risk of redundancy or furloughing, and those reliant on the aviation industry, such as Crawley and Derby, are likely to be hardest hit. These areas are also the places most likely to be worst affected if the Job Retention Scheme is withdrawn too soon.
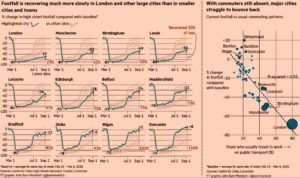
One interesting tool is the high street recovery tracker. This compares the economic performance of city centers since the outset of the Covid 19 crisis. At present they say footfall in the UKs 63 biggest cities has increased by seven percentage points in August and now reaches 63 per cent of pre-lockdown levels.

However, this figure hides great geographic differences: in 14 city centres, footfall in August exceeded pre-lockdown levels; particularly in seaside towns and smaller cities. At the other end of the spectrum, large cities like Manchester and Birmingham have barely recovered half of their pre-lockdown levels of activity.
Instead of relying on traditional surveys for this data, which would take some time to process and analyse, the recovery tracker is based on mobile phone analysis. Another potentially interesting non traditional source of data for understanding labour markets may be travel data, although that data is heavily disrupted by Covid 19. But that disruption in itself may be interesting, given the likelihood that those cities with continuing low travel to work numbers are likely to have a higher percentage of office based work, and possibly a focus on non customer based finance and administration employment. Conversely those cities where travel to work volumes are approaching near normal are probably more concentrated on retail and manufacturing industry.
All in all, there is a lot going on in novel data sources for labour market information. And of course we are also looking at how such data might be accessed:hence our Chatbot project.
