Archive for the ‘Data’ Category

LMI for All API released

June 9th, 2013 by Graham Attwell

I have written periodic updates on the work we have been doing for the UKCES on open data, developing an open API to provide access to Labour Market Information. Although the APi is specifically targeted towards careers guidance organisations and towards end users looking for data to help in careers choices, in the longer term it may be of interest to others involved in labour market analysis and planning and for those working in economic, education and social planning.

The project has had to overcome a number of barriers, especially around the issues of disclosure, confidentiality and statistical reliability. The first public release of the API is now available. The following text is based on an email sent to interested individuals and organisations. Get in touch if you would like more information or would like to develop applications based on the API.

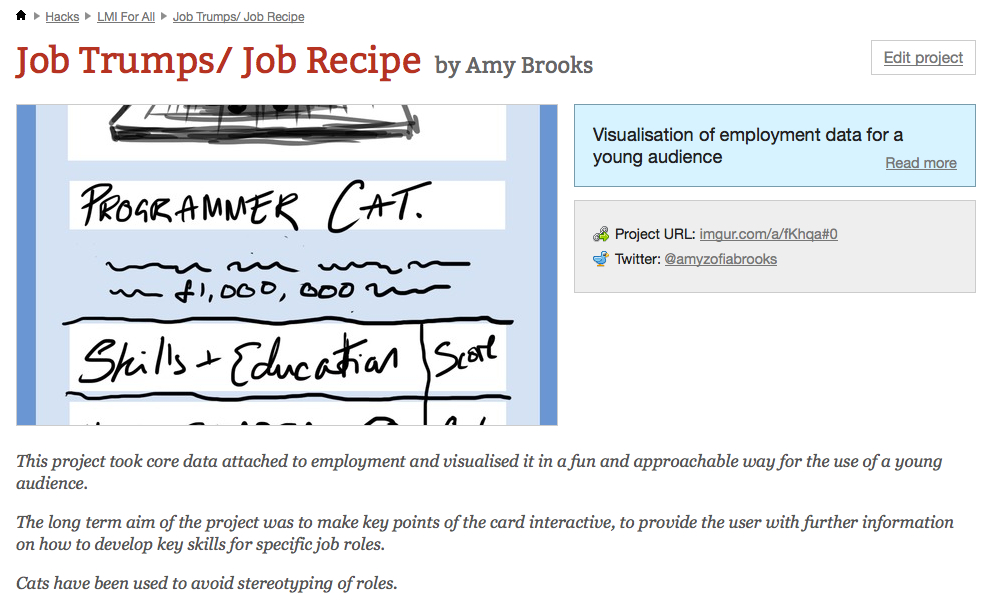
The screenshot above is of one of the ten applications developed at a hack day organised by one of our partners in the project, Rewired State. You can see all ten on their website.

The first pilot release of LMI for All is now available and to send you some details about this. Although this is a pilot version, it is fully functional and it would be great if you could test it as a pilot and let us know what is working well and what needs to be improved.

The main LMI for All site is at http://www.lmiforall.org.uk/.  This contains information about LMI for All and how it can be used.

The APi web explorer for developers can be accessed at http://api.lmiforall.org.uk/.  The APi is currently open for you to test and explore the potential for  development. If you wish to deploy the APi in your web site or application please email us at graham10 [at] mac [dot] com and we will supply you with an APi key.

For technical details and details about the data go to our wiki at http://collab.lmiforall.org.uk/.  This includes all the documentation including details about what data LMI for All includes and how this can be used.  There is also a frequently asked questions section.

Ongoing feedback from your organisation is an important part of the ongoing development of this data tool because we want to ensure that future improvements to LMI for All are based on feedback from people who have used it. To enable us to integrate this feedback into the development process, if you use LMI for All we will want to contact you about every four to six months to ask how things are progressing with the data tool. Additionally, to help with the promotion and roll out of LMI for All towards the end of the development period (second half of 2014), we may ask you for your permission to showcase particular LMI applications that your organisation chooses to develop.

If you have any questions, or need any further help, please use the FAQ space initially. However, if you have any specific questions which cannot be answered here, please use the LMI for All email address lmiforall [at] ukces [dot] org [dot] uk.
 

Big Data without Big Meaning is just like Crude Oil

June 9th, 2013 by Graham Attwell

I am doing some research at the moment on Big Data. There is truly a lot of hubris out there, never mind the controversy over privacy and the US security services attempts to mine our data.  I have found a few papers and presentations which provide a more thoughtful approach, among them this excellent presentation on Big Data and the future of journalism by Gerd Leonhard.

Anonymising open data

December 6th, 2012 by Graham Attwell

Here is the next in our occasional series about open and linked data. I wrote in a previous post that we are worki8ngt on developing an application for visualising Labour market Information for use in careers guidance.

One of the major issues we face is the anonymity of the data. fairly obviously, the mo0re sources of data are linked, the more possible it may become to identify people through the data. The UK information Commissioner’s Office has recently published a code of practice on “Anonymisation: managing data protection risk” and set up an Anonymisation Network. In the foreword to the code of practice they say:

The UK is putting more and more data into the public domain.

The government’s open data agenda allows us to find out more than ever about the performance of public bodies. We can piece together a picture that gives us a far better understanding of how our society operates and how things could be improved. However, there is also a risk that we will be able to piece together a picture of individuals’ private lives too. With ever increasing amounts of personal information in the public domain, it is important that organisations have a structured and methodical approach to assessing the risks.

The key points about the code are listed as:

  • Data protection law does not apply to data rendered anonymous in such a way that the data subject is no longer identifiable. Fewer legal restrictions apply to anonymised data.
  • The anonymisation of personal data is possible and can help service society’s information needs in a privacy-friendly way.
  • The code will help all organisations that need to anonymise personal data, for whatever purpose.
  • The code will help you to identify the issues you need to consider to ensure the anonymisation of personal data is effective.
  • The code focuses on the legal tests required in the Data Protection Act
Particularly useful are the Appendices which presents a list of key anonymisation techniques, examples and case studies and a discussion of the advantages and disadvantages of each. These include:
  • Partial data removal
  • Data quarantining
  • Pseudonymisation
  • Aggregation
  • Derived data items and banding
The report is well worth reading for anyone interested in open and linked data – even if you are not from the UK. Note for some reason files are downloading with an ashx suffix. But if you just change this locally to pdf they will  open fine.

Open data and Careers Choices

November 21st, 2012 by Graham Attwell

A number of readers have asked me about our ongoing work on using data for careers guidance. I am happy to say that after our initial ‘proof of process’ or prototype project undertaken for the UK Commission for Employment and Skills (UKCES), we have been awarded a new contract as part of a consortium to develop a database and open APi. The project is called LMI4All and we will work with colleagues from the University of Warwick and Raycom.

The database will draw on various sources of labour market data including the Office of National Statistics (ONS) Labour Force Survey (LFS) and the Annual survey of Hours and Earnings (ASHE). Although we will be developing some sample clients and will be organising a hackday and a modding day with external developers, it is hoped that the availability of an open API will encourage other organisations and developers to design and develop their own apps.

Despite the support for open data at a policy level in the UK and the launch of a series of measures to support the development of an open data community, projects such as this face a number of barriers. In the coming weeks, I will write a short series of articles looking at some of these issues.

In the meantime, here is an extract from the UKCES Briefing Paper about the project. You can download the full press release (PDF) at the bottom of this post. And if you would like to be informed about progress with the project, or better still are interested in being involved as a tester or early adapter, please get in touch.

What is LMI for All?

LMI for All is a data tool that the UK Commission for Employment and Skills is developing to bring together existing sources of labour market information (LMI) that can inform people’s decisions about their careers.

The outcome won’t be a new website for individuals to access but a tool that seeks to make the data freely available and to encourage open use by applications and websites which can bring the data to life for varying audiences.

At heart this is an open data project, which will support the wider government agenda to encourage use and re-use of government data sets.

What will the benefits be?

The data tool will put people in touch with some of the most robust LMI from our national surveys/sources therefore providing a common and consistent baseline for people to use alongside wider intelligence.

The data tool will have an access layer which will include guidance for developers about what the different data sources mean and how they can be used without compromising quality or confidentiality. This will help ensure that data is used appropriately and encourage the use of data in a form that suits a non-technical audience.

What LMI sources will be included?

The data tool will include LMI that can answer the questions people commonly ask when thinking about their careers, including ‘what do people get paid?’ and ‘what type of person does that job?’. It will include data about characteristics of people who work in different occupations, what qualifications they have, how much they get paid, and allow people to make comparisons across different jobs.

The first release of the data tool will include information from the Labour Force Survey and the Annual Survey of Hours and Earnings. We will be consulting with other organisations that own data during the project to extend the range of LMI available through the data tool.

LMI for All Briefing Paper

Using Google interactive charts and WordPress to visualise data

August 25th, 2012 by Graham Attwell

This is a rare techy post (and those of you who know me will also know that my techy competence is not so great so apologies for any mistakes).

Along with a university partner, Pontydysgu bid for a small contract to develop a system to allow the visualisation of labour market data. The contractors had envisaged a system which would update automatically from UK ONS quarterly labour market data: a desire clearly impossible within the scope of the funding.

So the challenge was to design something which would make it easy for them to manually update the data with visualisations being automatically updated from the amended data. Neither the contractors or indeed the people we were working with in the university had any great experience of using visualisation or web software.

The simplest applications seemed to me to be the best for this. Google spreadsheets are easy to construct and the interactive version of the chart tools will automatically update when embedded into a WordPress bog.

Our colleagues at the university developed a comprehensive spreadsheet and added some 23 or so charts.  So far so good. Now was the time to develop the website. I made a couple of test pages and everything looked good. I showed the university researchers how to edit in WordPress and how to add embedded interactive charts. And that is where the problems started. They emailed us saying that not only were their charts not showing but the ones i had added had disappeared!

The problem soon became apparent. WordPress, as a security feature, strips what it sees as dangerous JavaScript code. We had thought we could get round this by using a plug in called Raw.  However in a WordPress multi-site, this plug in will only allow SuperAdmins to post unfiltered html. This security seems to me over the top. I can see why wordpress.com will prevent unfiltered html. And I can see why in hosted versions unfiltered html might be turned off as a default. But surely, on a hosted version, it should be possible for Superadmins to have some kind of control over what kind of content different levels of users are allowed to post. The site we are developing is closed to non members so we are unlikely to have a security risk and the only Javascript we are posting comes from Google who might be thought to be trusted.

WordPress is using shortcodes for embeds. But there are no shortcodes for Google Charts embed. There is shortcode for using the Google Charts API but that would invalidate our aim of making the system easy to update. And of course, we could instead post an image file of the chart, but once more that would not be dynamically updated.

In the end my colleague Dirk hacked the WordPress code to allow editors to post unfiltered html but this is not an elegant answer!

We also added the Google code to Custom Fields allowing a better way to add the embeds.

Even then we hot another strange and time wasting obstacle. Despite the code being exactly the same, code copied and posted by our university colleagues was not being displayed. The only difference in the code is that when we posted it it had a lot of spaces, whist theirs appeared to be justified. It seems the problem is a Copy/ Paste bug in Microsoft Explorer 9, which is the default bowser in the university, which invalidates some of the javascript code. The work around for this was for them to install Firefox.

So (fingers crossed) it all works. But it was a struggle. I would be very grateful for any feedback – either on a better way of doing what we are trying to achieve – or on the various problems with WordPress and Google embed codes. Remember, we are looking for something cheap and easy!


Why Facebook IPO debacle may be good news

May 29th, 2012 by Graham Attwell

The Facebook IPO was very interesting for a number of reasons.

Facebook has managed to screw everybody. Firstly they persuaded us to sign over our data to them and then made a fortune out of selling it to others! And then they sold that model to investors a vastly over-hyped price.

At the end of the day Facebook has little market value, other than selling our data to advertisers. But in this they face three big challenges. The first is to actually get us to buy anything from Facebook ads. OK – I am pretty advert resistant. In fact I don’t actually ‘see’ most adverts. But if I do want to buy something, I certainly don’t go to Facebook. Like mots of us, I guess, I use a search engine. lately I have been using DuckDuckGo for the very reason that it doesn’t track my data, but if I use Google then very occasionally I might look at the sponsored results. More often though, I will buy a travel ticket and then find as a result of Google tracking, Guardian newspaper ads are advertising flight tickets to places I have already bought one for!

But back to Facebook. Their second challenge is getting us all to agree to open up our data. And that means relaxing privacy controls. So Facebook goes through a circle of relaxing privacy – leading to protests – and then having to produce new controls as a result.

But possibly more important in the long run is a commercial problem. Much of the protests around the IPO was that the banks behind the share release gave information to big customers which was withheld from smaller investors. And the main point of this was that Facebook are having problems selling adverts for the mobile version of the social networking site.

My guess is that it is not just Facebook. Whilst we can happily ignore advertising on a big screen, it becomes invasive and annoying on a mobile device. Quite simply users don’t like it.

Since Facebook’s financial model is built on selling targeted advertising and more and more people are using mobile devices to access the site, this is bad news for them. But what is bad news for Facebook (and Facebook investors) may be good news for the rest of us. It may force developers to move away from a model of selling our data to advertisers and look for more sustainable and – dare I say it – more people friendly and socially responsible business models.


Youth Unemployment in Europe

May 28th, 2012 by Graham Attwell

One of the results of the recession in Europe has been spiralling youth unemployment. VETNET, the vocational education and training network of the European Research Association, is planning a debate around youth unemployment at its annual conference in Seville in September.

As a contribution to that debate, I will be looking at some of the data about youth unemployment.

The main comparative data available is the European Labour Force Survey. and fortunately Google provide access to this data through its excellent Public Data Explorer site. This interactive charts shows the changes in youth unemployment in the different European Member States since 1983.


Open and Linked Data and Mediation

April 13th, 2012 by Graham Attwell

There has been an explosion of interest in Open Data and the potential for linking data to produce new social apps. Yet despite all this attentions, and the growing access to data in some countries such as the UK, the development of new apps has been less than impressive.

Rather than full apps, probably the main use has been the development of interactive visualizations allowing users to explore different data sets and quick visualisations of different data sets. The Guardian newspaper data blog has led the way in the UK and in particular has shown the value of open journalism such as in this discussion on how they got the colours of the maps right.

But the development of more advanced apps has been slower. Probably the biggest take off has been around transport allowing real time timetable tracking etc. But even here the problem of the social purpose and use of data apps is an issue. take this compelling app from the German newspaper Suddeutsche . Its hows graphic representations of train journeys in Germany, providing information on each train’s itinerary and the details of any delay. There is also an interactive timeline, allowing you to watch previous days’ travel play out. Its fun. But I can’t really see that it is much use! Or take this app – available in various forms – using crowd sourced data to find the nearest post box in the UK. Do we really need it? Why not just ask somebody / anybody?

In education there are a number of apps for finding schools etc. But there is little use of open and linked data for learning.

We have been working with a number of organisations to produce open and linked data apps for use in careers guidance. There are now three iterations of what we variously call a TEBO (Technologically Enhanced Boundary Object) or Careers dashboard.

The first was a quick demonstrator which we built to see how it might work. The second works through an API to the Careers Wales beta web site. And the third – more technically advanced – iteration is a database and API developed for UKCES which is not publicly available at present.

One of issues being raised in this work is mediation. In general government / agencies seem to regard data as just standing on its own. Within the TEBO concept we always stressed the need for social mediation and had ideas for a number of ways in which this might happen using social software e.g Question and Answer applications.

In fact mediation takes place at a series of levels – including the selection of data originally collected, and the way data is selected for use and display within an application. Different people will need different apps for interrogating the same data. For instance our Careers Dashboard may have potential interest and use for:

  • Young people thinking about career choices;
  •  Young people applying to further or higher education, seeking an apprenticeship or employment;
  • Adults who are newly unemployed;
  •  Long term unemployed adults;
  •  Adults considering re-entering education and training (e.g. women returners);
  • Adults thinking about a change in career direction (e.g. mid-career changers);
  • Parents and carers supporting young people wishing to enter further education, vocational training or employment
  • Career professionals – careers teachers, careers advisers and subject teachers; and
  • Various others (e.g. educational planners and policymakers, professionals preparing funding applications, researchers).

However, mediation seems to be commonly understood as intervention and then posed as a dichotomy between non intervention or intervention or to put it another way – let end users access to data or only let professionals access to data. This seems to me a misunderstanding of both the potentials and limitations of the data but of the potentially rich ways in which mediation happens and the ways in which technologically can be used in such processes.

It would be interesting to look at mediation within physical communities and through extended web and social media based communities. It would also be interesting to link mediation to the potential quality of careers interventions (i.e. after mediation takes place.)

More to follow…..


Using and visualising data

March 25th, 2012 by Graham Attwell
View more PowerPoint from Tony Hirst

Although this presentation is entitled ‘Data Driven Journalism’, it provides a great introduction for anyone wanting to use data – and more particularly data visualisations for research and development. Tont Hirst’s blog, OUseful blog, is a brilliant source of ideas for those interested in this fast growing area of work.

Finding and visualising Labour Market Data

March 25th, 2012 by Graham Attwell


Following my last post on creating a database for the LMI for All project, I am now beginning to explore what you can find out from the database.

One of the main sources for labour market data in the UK is the quarterly Labour Force Survey. Data on employment is collected under two main categories, the Standard Industrial Classification (SIC) about the industries in which people work, and the Standard Occupational Classification (SOC) about their occupation. Using our database API we can query the two classification systems against each other to find out how many people in a particular occupation work in which industries. We did this query on Friday for Computer Programmers. This gave us a long spreadsheet which was not particularly easy to understand. I cleaned the data and uploaded it to the IBM ManyEyes site and used the bubble visualisation which gives the graphic above. OK it is not perfect. The industry titles are too long for the index box. And maybe it provide too much data (I will look at what we get using a 3 figure SIC classification, rather than the present 4 figure SIC).

However I think it show potential. And there is no reason why we could not provide longitudinal and comparative data with a  bit of work.


  • Search Pontydysgu.org

    Social Media


    News Bites

    Cyborg patented?

    Forbes reports that Microsoft has obtained a patent for a “conversational chatbot of a specific person” created from images, recordings, participation in social networks, emails, letters, etc., coupled with the possible generation of a 2D or 3D model of the person.


    Racial bias in algorithms

    From the UK Open Data Institute’s Week in Data newsletter

    This week, Twitter apologised for racial bias within its image-cropping algorithm. The feature is designed to automatically crop images to highlight focal points – including faces. But, Twitter users discovered that, in practice, white faces were focused on, and black faces were cropped out. And, Twitter isn’t the only platform struggling with its algorithm – YouTube has also announced plans to bring back higher levels of human moderation for removing content, after its AI-centred approach resulted in over-censorship, with videos being removed at far higher rates than with human moderators.


    Gap between rich and poor university students widest for 12 years

    Via The Canary.

    The gap between poor students and their more affluent peers attending university has widened to its largest point for 12 years, according to data published by the Department for Education (DfE).

    Better-off pupils are significantly more likely to go to university than their more disadvantaged peers. And the gap between the two groups – 18.8 percentage points – is the widest it’s been since 2006/07.

    The latest statistics show that 26.3% of pupils eligible for FSMs went on to university in 2018/19, compared with 45.1% of those who did not receive free meals. Only 12.7% of white British males who were eligible for FSMs went to university by the age of 19. The progression rate has fallen slightly for the first time since 2011/12, according to the DfE analysis.


    Quality Training

    From Raconteur. A recent report by global learning consultancy Kineo examined the learning intentions of 8,000 employees across 13 different industries. It found a huge gap between the quality of training offered and the needs of employees. Of those surveyed, 85 per cent said they , with only 16 per cent of employees finding the learning programmes offered by their employers effective.


    Other Pontydysgu Spaces

    • Pontydysgu on the Web

      pbwiki
      Our Wikispace for teaching and learning
      Sounds of the Bazaar Radio LIVE
      Join our Sounds of the Bazaar Facebook goup. Just click on the logo above.

      We will be at Online Educa Berlin 2015. See the info above. The stream URL to play in your application is Stream URL or go to our new stream webpage here SoB Stream Page.

  • Twitter

  • Recent Posts

  • Archives

  • Meta

  • Categories