Archive for the ‘Open Data’ Category

Is all data research data?

September 30th, 2013 by Cristina Costa

In times when academia debates about the openness and transparency of academic work, and the processes associated with it, more questions than answers tend to be formulated.  And as it usually happens, different approaches often co-exist. There is nothing wrong with that. It is only natural when trying to make sense of the affordances that the web, as a space of participation and socialisation, provides. Nonetheless, the latests news on the openness of research publications leave me slightly concerned regarding the misunderstanding between the Open Access Gold Route and the Gold Mine publishing houses are trying to maintain with their take on Open Access. This will however be content for another post as this post relates to some still unripe reflections of mine on the topic of online research ethics. …although one could argue that paying to access publicly funded knowledge also touches on some ethics…!

The gate's unlocked!!!One of the big questions we are currently debating on twitter deals with the use of  data publicly available online. Given the current events regarding how governments are using information published online by their own citizens, we could conclude that no data is, or for that matter ever was, private! But as researchers interested in the prosumer phenomenon (online users who consume and produce content available on the web) a key issue arises when doing research online:

  • Can we use information that is publicly available online, i.e., that can be accessed without a password by any individual, for research purposes?
  • What ethics should we observe in this case?

Researching online data that is produced and made available online voluntarily, or involuntarily, by the regular citizen is so new, even to those in Technology Enhanced Learning (TEL), that we are still trying to make sense of how to go about this. Publications regarding this matter are still scare, and even those that I have had access to deal mainly with the issues of anonymity (Here is a recent example). A big issue indeed, especially in a time where participating online means to create an online digital footprint that not only allows information to be traced back to an individual; it also creates, to a certain extent, a (re)presentation of a given ‘self’, voluntarily or involuntarily… In TEL we call this “Digital Identities” (more on this in a forthcoming post).  Digital identities disclose personal, and sometimes private, information within the social environments that are created online and in which individuals interact, we assume, on their own will. But do they always do consciously of the publicness of the information they publish? Do they perceive their participation online as an form of creating and publishing information?

This then begs the question:

  • Is, can or should such information be automatically converted into research data? In other words are we, as researchers, entitled to use any data that is publicly available, even if we claim that it is only being used for research purposes?

My gut feeling is that no, we cannot! Just because the information is made publicly online and therefore accessible to use, I, as a researcher, am not entitled to use it without previously seeking and obtaining consent from its creator. This, obviously, generates more obstacles than those researchers would probably like to experience, but the truth is that collecting publicly available information without the consent of its producers does not seem right to me for the following reasons:

  1. We (people engaged in TEL) need to step outside of our own taken-for-granted understanding of online participation, and note that many people don’t realise, or at least have not given it considerate thought, that online communication can be public and that interaction online, by its very nature of written speech are more durable than equivalent forms of face-to-face interaction.
  2. Anonymity and confidentiality are topics that need to be discussed with the research participant independently of the type of information we want to use. Just because the content is there available to the world, it doesn’t mean it’s available for the take. That is invading the public sphere of an individual, if that makes any sense(!), because as it becomes research data we will be exposing (transferring even!) it to other public spaces.   of its owner.
  3. I truly believe that every research participants has the right to know he/she is one. This is not merely a courtesy on the part of the researcher, it is a right that they have! Content produced online, unless stated otherwise, belongs to its producer and should therefore be treated as such. (….maybe what we need is a creative commons license for research purposes! ]

Niessenbaum and Zimmer, amongst others, talk about contextual integrity, a theory that rejects the notion that information types fit into a rigid dichotomy of public or private.’ “Instead, there is potentially an indefinite variety of types of information that could feature in the informational norms of a given context, and whose categorization might shift from one context to another.” (Zimmer, 2008,  p.116)

Although I am very amenable to the argument of context, and that nothing is absolute, and everything is relative [getting philosophical now!], I think that the context of research practice begs for informed consent independently of the research data being publicly and privately available. In my opinion, converting online information into research data should always be an opt in, and not an opt out, activity involving those to whom the information belongs.

…but as usual, this is only my 2 cents and I look forward to other people’s views on this.
Citing and valueing Open Data

July 2nd, 2013 by Graham Attwell

The academic world has. perhaps unsurprisingly, been somewhat slow to respond to the challenge of recognising different sources of knowledge. A little strangely, one important step in developing recognition of different forms of scholarly research and knowledge is the development and use of forms of citation.

Si in that regard it is encouraging to see the publication of “The Amsterdam Manifesto on Data Citation Principles.”

In the preface they state:

We wish to promote best practices in data citation to facilitate access to data sets and to enable attribution and reward for those who publish data. Through formal data citation, the contributions to science by those that share their data will be recognized and potentially rewarded. To that end, we propose that:

1. Data should be considered citable products of research.

2. Such data should be held in persistent public repositories.

3. If a publication is based on data not included with the article, those data should be cited in the publication.

4. A data citation in a publication should resemble a bibliographic citation and be located in the publication’s reference list.

5. Such a data citation should include a unique persistent identifier (a DataCite DOI recommended, or other persistent identifiers already in use within the community).

6. The identifier should resolve to a page that either provides direct access to the data or information concerning its accessibility. Ideally, that landing page should be machine-actionable to promote interoperability of the data.

7. If the data are available in different versions, the identifier should provide a method to access the previous or related versions.

8. Data citation should facilitate attribution of credit to all contributors

The Manifesto was created during the Beyond the PDF 2 Conference in Amsterdam in March 2013.

The original authors were Mercè Crosas, Todd Carpenter, David Shotton and Christine Borgman.


Big data, issues and policies

June 21st, 2013 by Graham Attwell

I’ve been working this week on a report on data. I am part of a small team and the bit they have asked me to do is the use of big data, and particularly geo-spatial data, for governments. I am surprised by how much use is already being made of data, although patterns seem very uneven. We did a quick brainstorm in the office of potential areas where data could impact on government services and came up with the following areas:

  • Transport

– infrastructure and maintenance

  • Council Services

– planning

– Markets/Commerce

– Licenses

  • Environmental Services

– Waste and Recycling

– Protection

– Climate

– Woodlands

– Power monitoring

– Real – time monitoring

  • Health Services
  • Planning
  • Employment
  • Education
  • Social Services
  • Tourism
  • Heritage Services
  • Recreational Services
  • Disaster response
  • Disease analysis
  • Location tracking
  • Risk management/ modelling
  • Crime prevention
  • Service Management
  • Target achievements
  • Predictive maintenance

There seems little doubt that using more data could allow national, regional and local governments both to design more effective, efficient and personalised services. However there remain considerable issues and barriers to this development. These include:

  • Lack of skills and knowledge in government staff. There are already predictions of skills shortages for data programmers and analysts. With the rapid expansion in the use of big data in the private sector, the relatively lower levels of local government remuneration may make it difficult to recruit staff with the necessary knowledge and skills.
  • Pressure on public sector budgets. Although there are considerable potential cost savings through the use of big data in planning and providing services, this may require considerable up front investment in research and development. With the present pressure on public sector budgets there is a challenge in securing sufficient resources in this area. Lack of time to develop new systems and services
  • Lock-in to proprietary systems. Although many of the applications being developed are based on Open Source Software, there is a danger that in contracting through the private sector, government organisations and agencies will be locked into proprietary approaches and systems.
  • Privacy and Security. There is a general societal issue over data privacy and security. Obviously the more data available, the grater the potential for developing better and cost effective services. At the same time the deeper the linking of data, the more likely is it that data will be disclosive.
  • Data Quality and Compatibility. There would appear to be a wide variety in the quality of the different data sets presently available. Furthermore, the format of much published government data renders its use problematic. There is a need for open standards to ensure compatibility.
  • Data ownership. Even in the limited field of GIS data there are a wide range of different organisations who own or supply data. This may include public agencies, but also for instance utility and telecoms companies. They may not wish to share data or may wish to charge for this data.
  • Procurement regulations. Whilst much of the innovation in the use of data comes from Small and Medium Enterprises, procurement regulations and Framework Contracts tend to exclude these organisations from tendering for contracts.


LMI for All API released

June 9th, 2013 by Graham Attwell

I have written periodic updates on the work we have been doing for the UKCES on open data, developing an open API to provide access to Labour Market Information. Although the APi is specifically targeted towards careers guidance organisations and towards end users looking for data to help in careers choices, in the longer term it may be of interest to others involved in labour market analysis and planning and for those working in economic, education and social planning.

The project has had to overcome a number of barriers, especially around the issues of disclosure, confidentiality and statistical reliability. The first public release of the API is now available. The following text is based on an email sent to interested individuals and organisations. Get in touch if you would like more information or would like to develop applications based on the API.

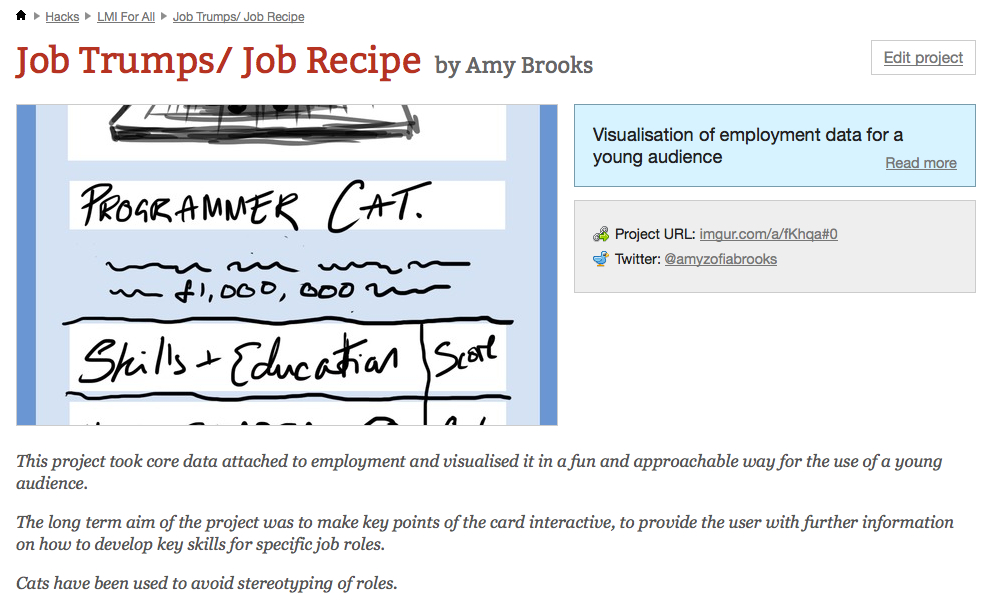
The screenshot above is of one of the ten applications developed at a hack day organised by one of our partners in the project, Rewired State. You can see all ten on their website.

The first pilot release of LMI for All is now available and to send you some details about this. Although this is a pilot version, it is fully functional and it would be great if you could test it as a pilot and let us know what is working well and what needs to be improved.

The main LMI for All site is at http://www.lmiforall.org.uk/.  This contains information about LMI for All and how it can be used.

The APi web explorer for developers can be accessed at http://api.lmiforall.org.uk/.  The APi is currently open for you to test and explore the potential for  development. If you wish to deploy the APi in your web site or application please email us at graham10 [at] mac [dot] com and we will supply you with an APi key.

For technical details and details about the data go to our wiki at http://collab.lmiforall.org.uk/.  This includes all the documentation including details about what data LMI for All includes and how this can be used.  There is also a frequently asked questions section.

Ongoing feedback from your organisation is an important part of the ongoing development of this data tool because we want to ensure that future improvements to LMI for All are based on feedback from people who have used it. To enable us to integrate this feedback into the development process, if you use LMI for All we will want to contact you about every four to six months to ask how things are progressing with the data tool. Additionally, to help with the promotion and roll out of LMI for All towards the end of the development period (second half of 2014), we may ask you for your permission to showcase particular LMI applications that your organisation chooses to develop.

If you have any questions, or need any further help, please use the FAQ space initially. However, if you have any specific questions which cannot be answered here, please use the LMI for All email address lmiforall [at] ukces [dot] org [dot] uk.


Learning Layers – What are we learning in the current phase of our fieldwork? (Part 2: Bau ABC)

June 8th, 2013 by Pekka Kamarainen

In my previous post I indicated that our current phase of fieldwork is preparing the grounds for participative co-design processes “for the users, with the users and by the users”. So far, we have had quite a lot of activities with the training centre Bau ABC and made also a lot of experiences with different workshops. Here, the blessing for us has been that we have had a chance to have joint workshops with groups of apprentices (during their stay at the centre) and with full-time trainers (at the time slots when apprentices have been working independently with their projects). Below some remarks on our workshops and on our learning experiences about their ways of making the workshops their events in which they address their own issues, concerns and initiatives.

Firstly, on the workshop concepts with which we worked: We firstly had conversational workshops with one group of apprentices (from different trades) in the morning and with a group of full-time trainers (Lehrwerkmeister) in the initial training plus the coordinator of continuing vocational training programmes. These workshops were supported by some pre-given guiding questions (Leitfragen) but they were run as relatively free conversation to let the participants address their issues with their own accents and their own voice. As a result, the apprentices spoke very freely of what they saw a needs and possibilities for improvement regarding the training in the centre (vis-a-vis advanced practice in the companies). They also emphasised their interest to have joint projects with apprentices from  neighbouring trades. The trainers gave positive comments on the views expressed by apprentices – however, they drew attention to rather inflexible boundary conditions for accommodating the apprentices’ training periods in the centre. Thus, there is very little room for manoeuvre for meeting the wishes of apprentices re joint projects or more flexible timing of periods in companies and in the centre. In addition, the trainers started giving thoughts, how they could use digital media and web appsa more effectively in informing themselves of new developments in the trade and on advanced practice in companies. Here, it seemed that something that was discussed in initial training was already in practice in the continuing vocational training activities.

In the next phase we organised a storyboard workshop that was based on group work to make storyboards of exemplary working days of apprentices (in the morning) and trainers (in the afternoon). The two parallel groups of apprentices had different tasks: one was invited to portray a day in the training centre whilst the other was asked to portray a day in the company and in the construction site. The group that worked with a day in the centre presented a spatial journey with drawings of different locations  at the Bau ABC sites and only after completing this started to give thoughts on eventual problems and how they could be taken into account in the phase of giving instructions. The group that focused on working at construction site portrayed the work flow (and the daily journey) from the company office to the site, setting the site and carrying through the process (drilling the holes for the well to be built) and in completing the task. Here, the apprentices drew attention to eventual obstacles and needs to star again or to give up if no water is found. Thus, they highlighted key problems in the work process – in which however the availability of web tools made very little difference. At the end of this session the joint plenary discussion started top trigger ideas of new apps to extend the learning effect and to draw attention to good practice  (e.g. the Maurer-App) and comments on the (limited) usability of existing apps.

The trainers gave very positive comments on the storyboards of apprentices and gave some thoughts of the possible usability of existing apps as a basis for the proposed Maurer-App. In their own group work phase they presented two parallel storyboards of trainers work at the centre. One story focused on a relatively homogeneous group of apprentices in the initial training whilst the other illustrated the growing complexity when there are apprentices from different phases of their training and eventual visiting groups in continuing training (with visiting trainers) to be supported at the same time. Altogether, the storyboards drew much more attention to the complex social and organisational processes to be managed alongside the key training functions  (instruction, supervision, monitoring, assessing and giving feedback). In the plenary sessions a lot of thoughts were given on the possibilities to offload the trainers with digital solutions in the assessment and in giving feedback. A major issue was the access to norms, standards and regulations in which context new copyright problems had emerged. As a result, a list of several design ideas and issues was drafted to be included into the workshop report (to take into account the issues arising from initial and continuing training).

Here I have emphasised the workshop dynamics rather than particular ‘results’ to be listed as apps or solutions that would have attracted most attention. In the preparation phase our colleagues suggested different techniques to get feedback on particular ‘use cases’ or wireframes drafted on the drawing boards elsewhere. As I have illustrated it above, when the users got control of their workshops, they addressed concerns, how to improve their working and learning processes on the whole. When getting their messages into discussion we then could use  some time to illustrate some of the use cases and emerging wireframes as possible responses to their concerns. In this context the powerpoint slides and the presentation of Martin Bachl (Hochschule Karlsruhe) worked very well.

As I understand it, we are going through similar collaborative learning processes as the earlier Work and Technology projects that couldn’t successfully transplant new technologies into companies as ‘gifts that fall  from Mt Olympus that are parachuted upon users’ but had to discover the possible needs for innovations and benefits for users in iterative processes that took their own time. Yet, after these experiences we have the feeling the we are making progress.

To be continued …

Acknowledgements. This work is supported by the European Commission under the FP7 project LAYERS (no. 318209), http://www.learning-layers.eu.

LMI for All – coming soon

May 12th, 2013 by Graham Attwell

A quick and overdue update on the Labour Market Information for All project, which we are developing together with Raycom, the University of Warwick and Rewired State and  is sponsored by the UK Commission for Employment and Skills (UKCES).

LMI for All will provide an online data portal bringing together existing sources of labour market information (LMI) that can inform people’s decisions about their careers.  The database will contain robust LMI from national surveys and data sources providing a common and consistent baseline to use alongside less formal sources of intelligence. Due for release at the end of May 2013, access to the database will be through an open API. the results of queries can then be embedded by developers in their own web sites of apps. We will also provide a code library to assist developers.

The project builds on the commitment by the UK government to open data. despite this, it is not simple. As the Open Data White Paper (HM Government, 2012)highlights,  data gathered by the public sector is not always readily accessible. Quality of the data, intermittent publication and a lack of common standards are also barriers. A commitment is given to change the culture of organisations, to bring about change: ‘This must change and one of the barriers to change is cultural’ (p. 18).

We have talked to a considerable number of data providers including government bodies. It is striking that all have been cooperative and wishing to help us in providing access to data. However, the devil is in the detail.

Much of the data publicly collected, is done so on the condition that is is non disclosive e.e. that it is impossible to find out who submitted that data. And of course the lower the level of aggregation, the easier it is to identify where the data is coming from. And the more the data is linked, the more risk there s of disclosure.

We have developed ways of getting round this using both statistical methods (e.g. estimation) and technical approaches (data aggregation). But it remains a lot of work preparing the data for uploading to our database. And I guess that level of work will discourage others from utilising the potential of open data. It may explain why, transport excluded, their remain limited applications built on the open data movement in the UK.

It may suggest that the model we are working on, of a publicly funded project providing access to data, and then providing tools to build applications on top of that data, could provide a model for providing access to public data.

In the meantime if you are interested in using our API and developing your own applications for careers guidance and support, please get in touch.


Anonymising open data

December 6th, 2012 by Graham Attwell

Here is the next in our occasional series about open and linked data. I wrote in a previous post that we are worki8ngt on developing an application for visualising Labour market Information for use in careers guidance.

One of the major issues we face is the anonymity of the data. fairly obviously, the mo0re sources of data are linked, the more possible it may become to identify people through the data. The UK information Commissioner’s Office has recently published a code of practice on “Anonymisation: managing data protection risk” and set up an Anonymisation Network. In the foreword to the code of practice they say:

The UK is putting more and more data into the public domain.

The government’s open data agenda allows us to find out more than ever about the performance of public bodies. We can piece together a picture that gives us a far better understanding of how our society operates and how things could be improved. However, there is also a risk that we will be able to piece together a picture of individuals’ private lives too. With ever increasing amounts of personal information in the public domain, it is important that organisations have a structured and methodical approach to assessing the risks.

The key points about the code are listed as:

  • Data protection law does not apply to data rendered anonymous in such a way that the data subject is no longer identifiable. Fewer legal restrictions apply to anonymised data.
  • The anonymisation of personal data is possible and can help service society’s information needs in a privacy-friendly way.
  • The code will help all organisations that need to anonymise personal data, for whatever purpose.
  • The code will help you to identify the issues you need to consider to ensure the anonymisation of personal data is effective.
  • The code focuses on the legal tests required in the Data Protection Act
Particularly useful are the Appendices which presents a list of key anonymisation techniques, examples and case studies and a discussion of the advantages and disadvantages of each. These include:
  • Partial data removal
  • Data quarantining
  • Pseudonymisation
  • Aggregation
  • Derived data items and banding
The report is well worth reading for anyone interested in open and linked data – even if you are not from the UK. Note for some reason files are downloading with an ashx suffix. But if you just change this locally to pdf they will  open fine.

Open data and Careers Choices

November 21st, 2012 by Graham Attwell

A number of readers have asked me about our ongoing work on using data for careers guidance. I am happy to say that after our initial ‘proof of process’ or prototype project undertaken for the UK Commission for Employment and Skills (UKCES), we have been awarded a new contract as part of a consortium to develop a database and open APi. The project is called LMI4All and we will work with colleagues from the University of Warwick and Raycom.

The database will draw on various sources of labour market data including the Office of National Statistics (ONS) Labour Force Survey (LFS) and the Annual survey of Hours and Earnings (ASHE). Although we will be developing some sample clients and will be organising a hackday and a modding day with external developers, it is hoped that the availability of an open API will encourage other organisations and developers to design and develop their own apps.

Despite the support for open data at a policy level in the UK and the launch of a series of measures to support the development of an open data community, projects such as this face a number of barriers. In the coming weeks, I will write a short series of articles looking at some of these issues.

In the meantime, here is an extract from the UKCES Briefing Paper about the project. You can download the full press release (PDF) at the bottom of this post. And if you would like to be informed about progress with the project, or better still are interested in being involved as a tester or early adapter, please get in touch.

What is LMI for All?

LMI for All is a data tool that the UK Commission for Employment and Skills is developing to bring together existing sources of labour market information (LMI) that can inform people’s decisions about their careers.

The outcome won’t be a new website for individuals to access but a tool that seeks to make the data freely available and to encourage open use by applications and websites which can bring the data to life for varying audiences.

At heart this is an open data project, which will support the wider government agenda to encourage use and re-use of government data sets.

What will the benefits be?

The data tool will put people in touch with some of the most robust LMI from our national surveys/sources therefore providing a common and consistent baseline for people to use alongside wider intelligence.

The data tool will have an access layer which will include guidance for developers about what the different data sources mean and how they can be used without compromising quality or confidentiality. This will help ensure that data is used appropriately and encourage the use of data in a form that suits a non-technical audience.

What LMI sources will be included?

The data tool will include LMI that can answer the questions people commonly ask when thinking about their careers, including ‘what do people get paid?’ and ‘what type of person does that job?’. It will include data about characteristics of people who work in different occupations, what qualifications they have, how much they get paid, and allow people to make comparisons across different jobs.

The first release of the data tool will include information from the Labour Force Survey and the Annual Survey of Hours and Earnings. We will be consulting with other organisations that own data during the project to extend the range of LMI available through the data tool.

LMI for All Briefing Paper

What is happening with open data?

October 10th, 2012 by Graham Attwell

One of the better actions undertaken in the later days of the last UK Labour government was to embrace the open data movement. Following a campaign lead by Nigel Shadbolt and Tim Berners Lee and backed by the Guardian newspaper under the slogan (if I remember right) of  ‘Free our Data’, the governement agreed in pronciple that much of governement funded data should be placed in teh public domain and be freely reusable. The campain was sparked by plans to chanrge large fees for  access to mapping data produced by the publicly owned and funded Ordnance Survey agency.

A new website – data.gov.uk –  was set up as an access point for data and to allow developers to post links to tools and apps.

When Labour lost power to the new right wing Conservative- Liberal Democrat Coalition, many feared for the future of the initiative. Yet somewhat surprisingly the new Government embraced the Open Data movement, putting pressure on local governmental bodies to allow free access to their data. Partly this may have been due to a libertarian approach to more open government. However more important may have been research suggesting that there could be a major new market for private enterprises producing apps based on open data.

However such a vision seems to have been misplaced. A cursory examination of the apps page on the data.gov.uk web site suggests a steady stream of new apps. However many of these are of a relatively limited appeal or have mainly a research use. I selected an app at random from the app site and came up with ‘Accident Blackspots in England’ which provides a series of embeddable maps plotting accident rates per thousand registered vehicles in England using 2010 data from The Department of Transport.  I am sure this will be of use to planning specialists but is hardly the kind of thing people are going to pay for on an app store. There are also quite a few apps providing access to the league tables of pubic sector performance so beloved  previous labour gvernement – e.g school league tables. Once more probably not the most marketable of products.

The one category in which there has been some modest take off is in transport apps. However even here these are very much focused on the heavily poulated urban cities with little of use for more rural areas.

So what has gone wrong – if indeed anything has? Whilst it is very welcome that such data is being openly released and this is a boon for research, the truth is that only a very limited subset of data is going to be of general interest. And even within this subset, the differences in the way data is formatted and presented and the uncertainty of in what form future such data will be released, means that working with such open data is not simple – especially if developers wish to link different data sets. I doubt that a major market will emerge based on open public data. I believe that open data will fuel research and public service development. However apps providing access to services will continue to require public support, if only to clean and standardise data and provide a more advanced data service to app developers, rather than just access to raw data.


Using Google interactive charts and WordPress to visualise data

August 25th, 2012 by Graham Attwell

This is a rare techy post (and those of you who know me will also know that my techy competence is not so great so apologies for any mistakes).

Along with a university partner, Pontydysgu bid for a small contract to develop a system to allow the visualisation of labour market data. The contractors had envisaged a system which would update automatically from UK ONS quarterly labour market data: a desire clearly impossible within the scope of the funding.

So the challenge was to design something which would make it easy for them to manually update the data with visualisations being automatically updated from the amended data. Neither the contractors or indeed the people we were working with in the university had any great experience of using visualisation or web software.

The simplest applications seemed to me to be the best for this. Google spreadsheets are easy to construct and the interactive version of the chart tools will automatically update when embedded into a WordPress bog.

Our colleagues at the university developed a comprehensive spreadsheet and added some 23 or so charts.  So far so good. Now was the time to develop the website. I made a couple of test pages and everything looked good. I showed the university researchers how to edit in WordPress and how to add embedded interactive charts. And that is where the problems started. They emailed us saying that not only were their charts not showing but the ones i had added had disappeared!

The problem soon became apparent. WordPress, as a security feature, strips what it sees as dangerous JavaScript code. We had thought we could get round this by using a plug in called Raw.  However in a WordPress multi-site, this plug in will only allow SuperAdmins to post unfiltered html. This security seems to me over the top. I can see why wordpress.com will prevent unfiltered html. And I can see why in hosted versions unfiltered html might be turned off as a default. But surely, on a hosted version, it should be possible for Superadmins to have some kind of control over what kind of content different levels of users are allowed to post. The site we are developing is closed to non members so we are unlikely to have a security risk and the only Javascript we are posting comes from Google who might be thought to be trusted.

WordPress is using shortcodes for embeds. But there are no shortcodes for Google Charts embed. There is shortcode for using the Google Charts API but that would invalidate our aim of making the system easy to update. And of course, we could instead post an image file of the chart, but once more that would not be dynamically updated.

In the end my colleague Dirk hacked the WordPress code to allow editors to post unfiltered html but this is not an elegant answer!

We also added the Google code to Custom Fields allowing a better way to add the embeds.

Even then we hot another strange and time wasting obstacle. Despite the code being exactly the same, code copied and posted by our university colleagues was not being displayed. The only difference in the code is that when we posted it it had a lot of spaces, whist theirs appeared to be justified. It seems the problem is a Copy/ Paste bug in Microsoft Explorer 9, which is the default bowser in the university, which invalidates some of the javascript code. The work around for this was for them to install Firefox.

So (fingers crossed) it all works. But it was a struggle. I would be very grateful for any feedback – either on a better way of doing what we are trying to achieve – or on the various problems with WordPress and Google embed codes. Remember, we are looking for something cheap and easy!


  • Search Pontydysgu.org

    Social Media


    News Bites

    Cyborg patented?

    Forbes reports that Microsoft has obtained a patent for a “conversational chatbot of a specific person” created from images, recordings, participation in social networks, emails, letters, etc., coupled with the possible generation of a 2D or 3D model of the person.


    Racial bias in algorithms

    From the UK Open Data Institute’s Week in Data newsletter

    This week, Twitter apologised for racial bias within its image-cropping algorithm. The feature is designed to automatically crop images to highlight focal points – including faces. But, Twitter users discovered that, in practice, white faces were focused on, and black faces were cropped out. And, Twitter isn’t the only platform struggling with its algorithm – YouTube has also announced plans to bring back higher levels of human moderation for removing content, after its AI-centred approach resulted in over-censorship, with videos being removed at far higher rates than with human moderators.


    Gap between rich and poor university students widest for 12 years

    Via The Canary.

    The gap between poor students and their more affluent peers attending university has widened to its largest point for 12 years, according to data published by the Department for Education (DfE).

    Better-off pupils are significantly more likely to go to university than their more disadvantaged peers. And the gap between the two groups – 18.8 percentage points – is the widest it’s been since 2006/07.

    The latest statistics show that 26.3% of pupils eligible for FSMs went on to university in 2018/19, compared with 45.1% of those who did not receive free meals. Only 12.7% of white British males who were eligible for FSMs went to university by the age of 19. The progression rate has fallen slightly for the first time since 2011/12, according to the DfE analysis.


    Quality Training

    From Raconteur. A recent report by global learning consultancy Kineo examined the learning intentions of 8,000 employees across 13 different industries. It found a huge gap between the quality of training offered and the needs of employees. Of those surveyed, 85 per cent said they , with only 16 per cent of employees finding the learning programmes offered by their employers effective.


    Other Pontydysgu Spaces

    • Pontydysgu on the Web

      pbwiki
      Our Wikispace for teaching and learning
      Sounds of the Bazaar Radio LIVE
      Join our Sounds of the Bazaar Facebook goup. Just click on the logo above.

      We will be at Online Educa Berlin 2015. See the info above. The stream URL to play in your application is Stream URL or go to our new stream webpage here SoB Stream Page.

  • Twitter

  • Recent Posts

  • Archives

  • Meta

  • Categories